
Strong growth, just below plan
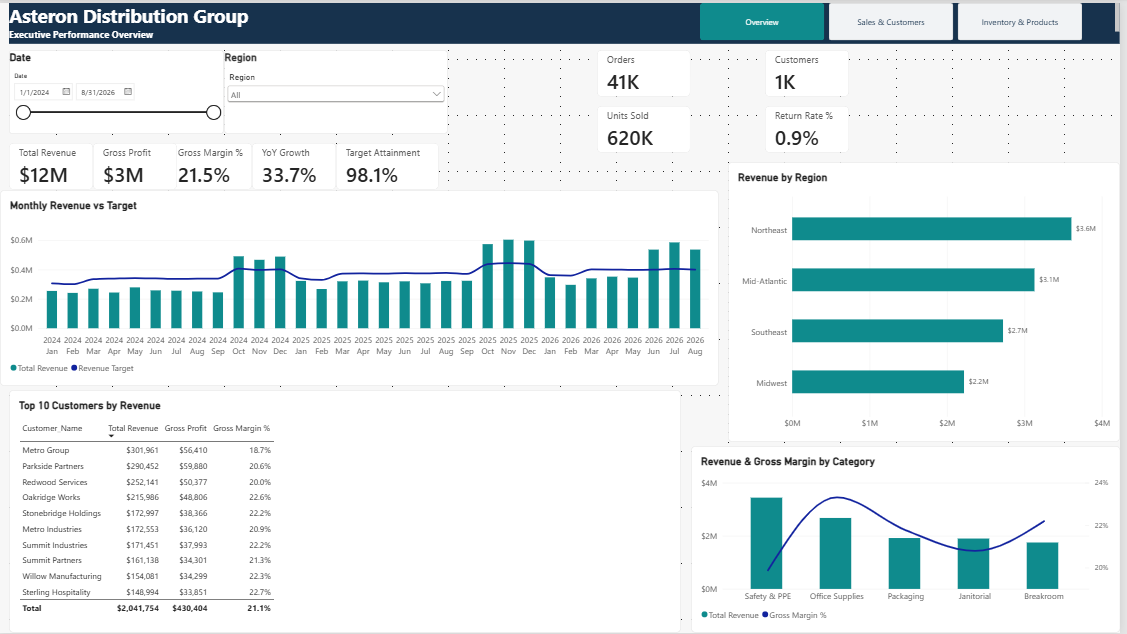
Revenue reached approximately $12M with 33.7% YoY growth and 98.1% target attainment.
POWER BI PORTFOLIO CASE STUDY
From scattered source files to a three-page management reporting system covering revenue, profitability, customers, sales performance, and inventory risk.
Fictional company • Synthetic dataset • Built to demonstrate Jix Analytics & Advisory capabilities
THE CHALLENGE
Asteron's sales, customer, target, product, and inventory information was represented across multiple business files. The reporting challenge was to consolidate those sources into a clear management view without losing the detail needed for deeper analysis.
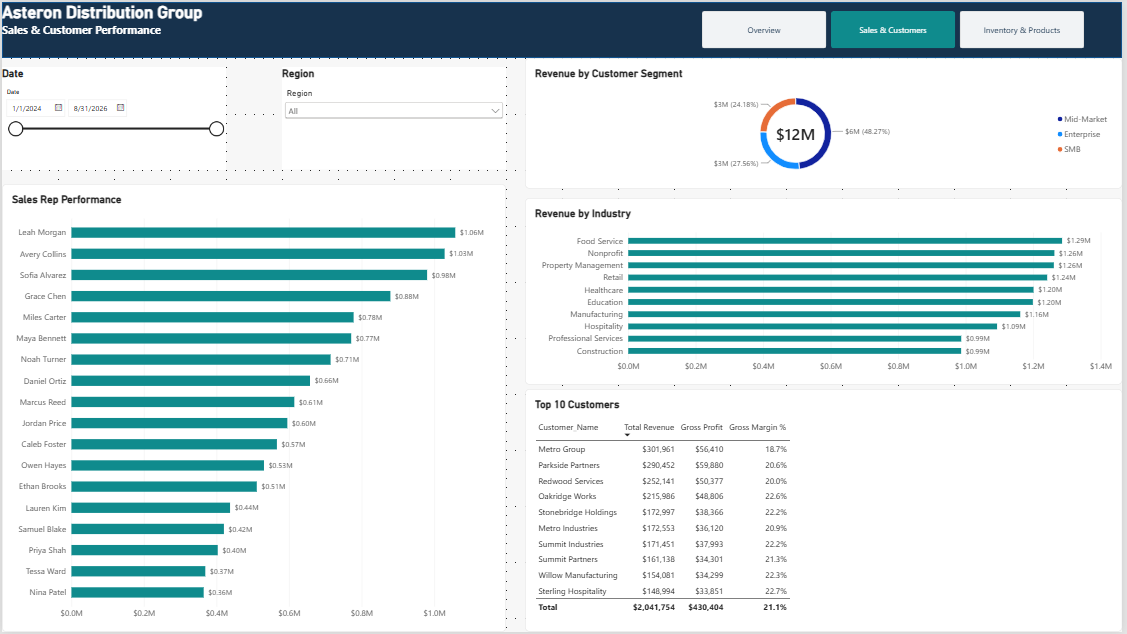
The goal was not simply to create charts. It was to build an interactive reporting structure that could answer the questions management would actually ask: Are we growing? Are we on target? Where is revenue coming from? Which customers and sales reps matter most? Where are margin and inventory risks developing?
EXECUTIVE OVERVIEW
KEY FINDINGS
Revenue reached approximately $12M with 33.7% YoY growth and 98.1% target attainment.
The Northeast generated roughly $3.6M, ahead of Mid-Atlantic, Southeast, and Midwest performance.
Safety & PPE led revenue while Office Supplies delivered the strongest gross-margin rate, highlighting the need to manage both volume and profitability.
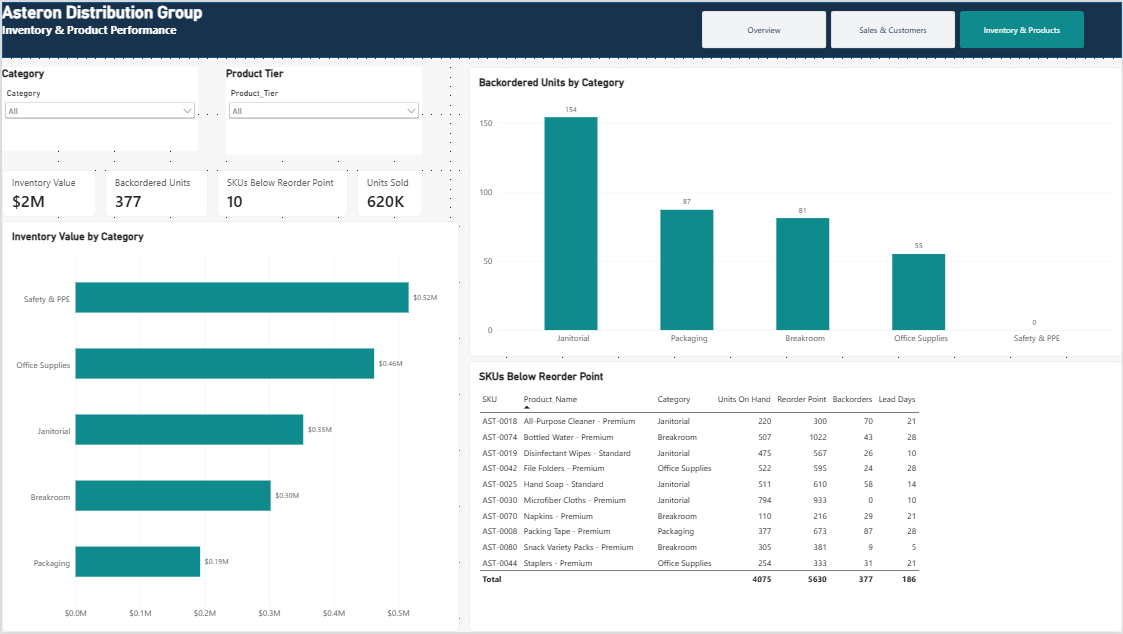
Ten SKUs were below reorder point and Janitorial represented the largest category-level backorder exposure.
DEEPER ANALYSIS
WHAT JIX BUILT
HAVE A SIMILAR REPORTING PROBLEM?