
Six reps materially exceeded target
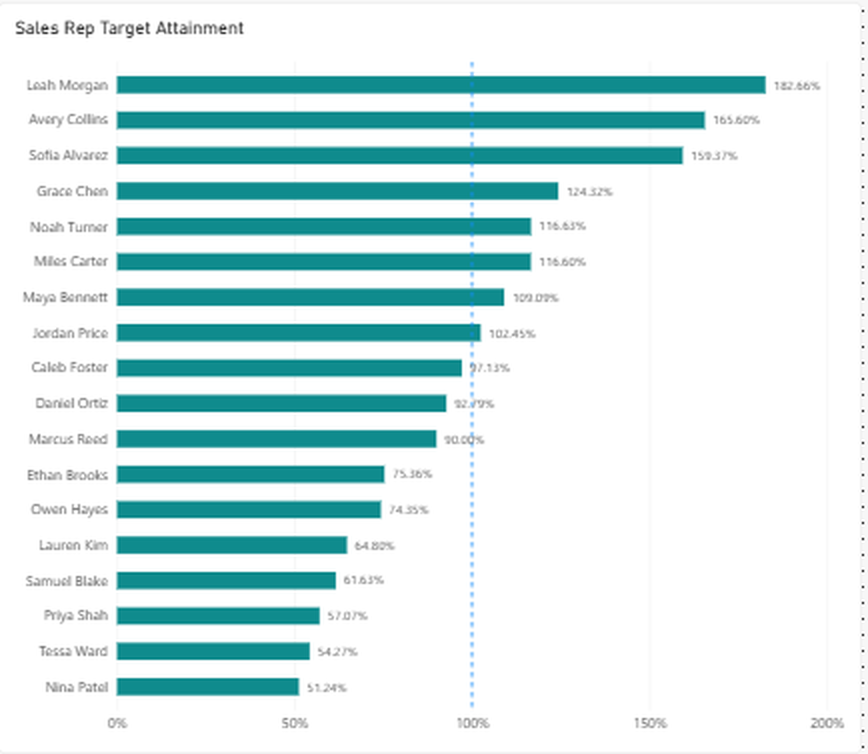
Six representatives were at or above 110% attainment. They are not simply high-volume sellers; they are outperforming the expectations set for them.
ASTERON DEEP DIVE · ANALYSIS NOTE
Revenue is useful. It can also flatter underperformance.
In this Power BI deep dive, we reframe sales-rep performance around target attainment and profitability context so management can distinguish high volume from actual performance — and decide where intervention is needed.
Asteron Distribution Group is a fictional company using synthetic data. This analysis note demonstrates our Jix Analytics & Advisory methodology.
THE BUSINESS QUESTION
We started with a sales-rep view that ranked people primarily by revenue. That was useful for understanding volume, but weak for performance management when representatives carried different targets.
If two reps each generate $650K, but one was expected to deliver $600K and the other $800K, a revenue leaderboard makes them look similar. Management should not.
We therefore changed the reporting question from “Who generated the most revenue?” to “Who delivered against expectations, and what does management need to do next?”
THE REPORTING SHIFT
We rank representatives by Target Attainment %, add a 100% target reference line, and keep Revenue, Revenue Target, Gross Profit, and Gross Margin available as supporting context.
WHAT SURFACED
Six representatives were at or above 110% attainment. They are not simply high-volume sellers; they are outperforming the expectations set for them.
Three representatives sat between 90% and 99.99%. A rep at 97% may need a final push, not the same intervention as a rep far below plan.
Seven representatives were below 90% attainment, with the lowest at 51.24%. That calls for diagnosis across territory, account mix, activity, pipeline, capability, or product fit.
Gross-margin rates were relatively stable across reps, suggesting the larger performance issue was sales volume relative to target rather than major differences in margin quality.
MANAGEMENT LOGIC
Protect what is working. Understand whether performance is repeatable and where best practices can transfer.
Maintain momentum and watch pipeline quality rather than creating unnecessary intervention.
Identify the shortest path to plan: late-stage opportunities, territory support, account focus, or execution help.
Diagnose before prescribing. Low attainment can reflect execution, territory design, customer mix, product mix, or capacity.
THE TAKEAWAY
It should help management see who is actually doing the job they were asked to do — and where the next conversation belongs.