Revenue was +11.3% YoY and +1.2% vs plan. The shortfall did not begin with demand.
HARBORLINE COMPONENTS GROUP · FINANCE & EXECUTIVE REPORTING
Growth Without Leverage: When Revenue Rises Faster Than Profit
Harborline's sales were growing. Its economics were not keeping up.
The headline looked healthy: 2026 YTD revenue was up 11.3% year over year and 1.2% above plan. But gross profit fell, margin compressed, operating profit reached only a fraction of budget, and receivables quality deteriorated. The reporting challenge was not to display those facts. It was to connect them.
Harborline Components Group is a fictional B2B manufacturer-distributor using synthetic data. The analysis is designed to demonstrate the Jix Analytics & Advisory approach to finance, performance, and management reporting.
+11.3%Revenue YoY
30.8%Gross margin
26.1%Operating profit attainment
29.5%AR past due
THE MANAGEMENT QUESTION
How can revenue beat plan while operating profit lands at only 26% of plan?
A revenue miss would have been the easy explanation. Harborline did not have one. Through August, revenue was $21.06M — 11.3% above the comparable prior-year period and 1.2% above budget — yet operating profit was only $321K against roughly $1.23M planned.
That gap forced a different line of inquiry: where was the economic value leaking between the top line and cash? We followed the evidence through product margin, price realization, unit cost, customer discounting, operating expenses, and receivables.
4,095sales lines
75customers
20products
889Opex entries
121open AR invoices
01 · EXECUTIVE PERFORMANCE
The first clue: the operating-profit miss was primarily a gross-profit problem.
Revenue tracked plan closely. The operating-profit bridge shows where the miss actually formed.
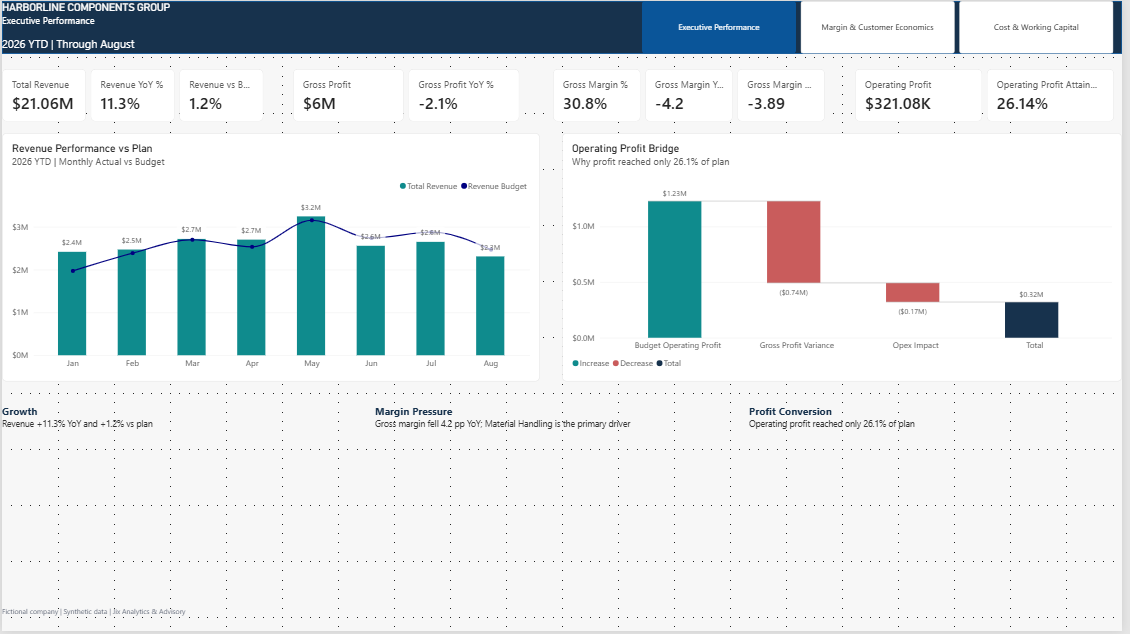
Gross profit declined despite higher revenue, taking gross margin from about 35.0% to 30.8%.
About four-fifths of the operating-profit shortfall came from gross-profit underperformance; Opex pressure compounded it.
02 · MARGIN DIAGNOSIS
Material Handling was not selling dramatically less. It was earning materially less on what it sold.
That distinction matters. A volume problem calls for pipeline and demand action. A unit-economics problem calls for pricing, sourcing, and commercial discipline.
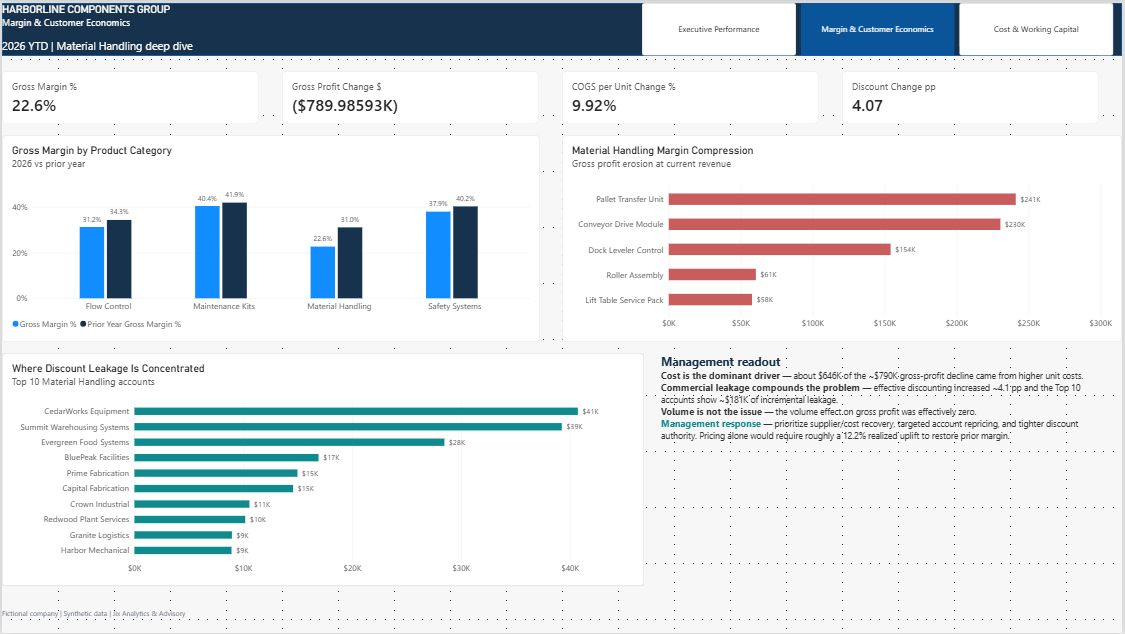
The category-level margin collapse was broad, not isolated.
Material Handling revenue was only 1.7% below the comparable prior-year period, but gross profit fell about 28.3%. Gross margin dropped from 31.0% to 22.6% — an 8.4-point deterioration. Every one of the five products in the category lost roughly 7.5 to 9.1 margin points, which argues against a single-SKU anomaly.
The profit bridge sharpened the diagnosis: approximately $646K of the ~$790K gross-profit decline came from higher unit cost, about $141K from weaker realized pricing, and only about $2K from volume. Unit cost rose roughly 9.9% while average selling price fell about 2.0%.
CUSTOMER ECONOMICS
Discount leakage was widespread enough to be a governance issue — but concentrated enough to prioritize.
Among the ten largest Material Handling customers, incremental discount leakage versus the prior year totaled about $181K. The top three accounts contributed roughly 60% of that amount. CedarWorks Equipment and Summit Warehousing Systems combined high revenue with the sharpest discount expansion and weak contribution margins.
The practical implication is not “raise every price.” It is to sequence account-level repricing where revenue exposure, discount expansion, and contribution-margin weakness overlap, while addressing the larger supplier-cost problem in parallel.
03 · COST & WORKING CAPITAL
The P&L pressure did not stop at gross margin — and the cash-conversion picture was worsening too.
Operating costs were above plan, but the pattern was concentrated. Receivables deterioration was broader and faster than the growth in AR itself.
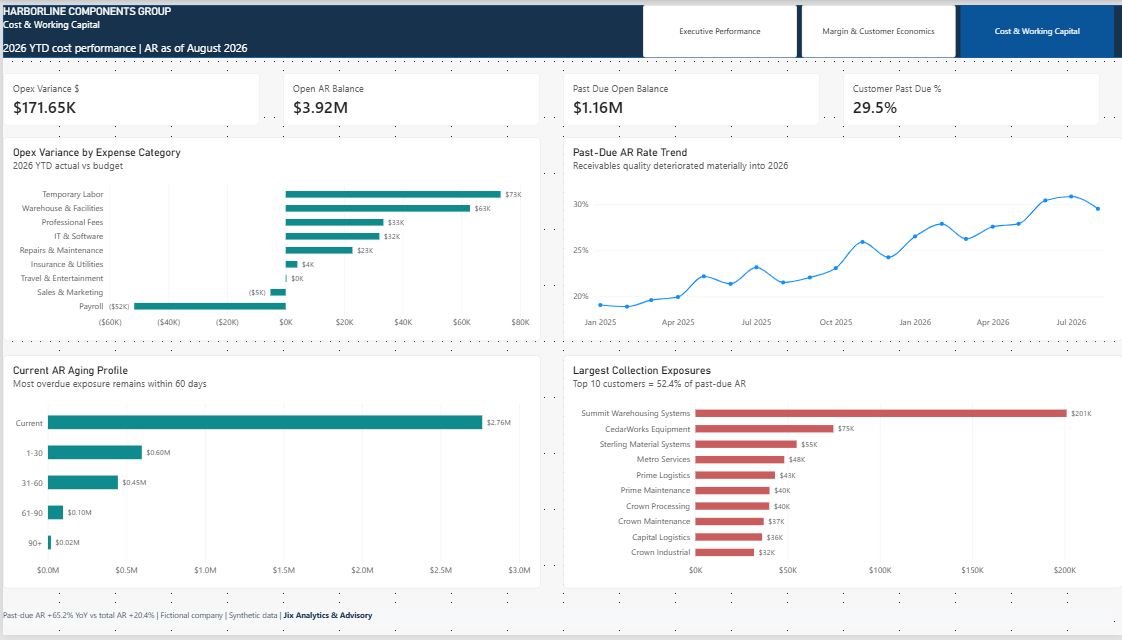
Net Opex variance hid a more specific operating pattern.
Opex finished about $171.7K above budget, or 2.9%. Five expense categories explained roughly 97% of gross adverse variance. Temporary Labor (+$73K), Warehouse & Facilities (+$63K), and Repairs & Maintenance (+$23K) were each above plan in every month from January through August.
At the same time, Operations payroll was favorable to budget. That combination supports a capacity-pressure hypothesis: the business may be containing permanent payroll while absorbing demand or operational strain through temporary labor and infrastructure spend. The data supports the pattern; it does not prove the cause. Vacancy, overtime, utilization, and staffing-capacity data would be needed to validate it.
RECEIVABLES QUALITY
AR grew 20%. Past-due AR grew 65%.
By August 2026, total open AR was about $3.92M, up 20.4% year over year. Past-due AR reached $1.16M, up 65.2%, pushing the past-due rate from roughly 21.5% to 29.5%.
The aging profile matters. Roughly 90% of past-due dollars were still within 60 days, so this was not yet a portfolio dominated by deeply aged debt. It was a collection-velocity problem with a meaningful intervention window. The top ten delinquent customers represented 52.4% of past-due AR; Summit Warehousing Systems alone represented 17.4%.
MANAGEMENT PRIORITIES
The point of the analysis is not to produce more metrics. It is to narrow the next decisions.
Recover Material Handling economics
Start with the products carrying the largest margin-compression dollars — Pallet Transfer Unit, Conveyor Drive Module, and Dock Leveler Control — and split the response between supplier-cost recovery and customer-level price realization.
Tighten discount governance
Review high-value accounts where discount expansion and weak contribution margin coincide. Set approval thresholds and track realized price, not only list-price changes.
Test the capacity-pressure hypothesis
Reconcile favorable payroll with persistent temporary-labor, facility, and maintenance overruns using vacancy, overtime, throughput, utilization, and staffing-capacity data.
Intervene before AR ages further
Prioritize the largest delinquent exposures, then manage the 1–60 day bucket aggressively while most overdue dollars are still recoverable through normal collections rather than escalation.
WHAT WE WOULD NOT CONCLUDE
A useful analysis is as much about what the data cannot prove as what it can.
“Sales are the problem.”
No. Revenue was above plan. The larger issue was profit conversion.
“Opex caused the profit miss.”
Not primarily. The gross-profit shortfall accounted for most of the operating-profit gap.
“Raise prices across the board.”
Too blunt. Cost inflation dominated the margin decline, while discount leakage varied by customer. The response should be segmented.
“Past-due AR is bad debt.”
The data does not support that. Most delinquency remained inside 60 days; the immediate signal is deteriorating collection speed.
METHOD
Built from the management question backward.
The model separates transaction-level sales, Opex actuals and open invoices from monthly budgets and AR snapshots, then uses shared dimensions for customer, product, category, department, expense category, and calendar analysis.
Before designing the report, we reconciled control totals and tested the economic story with prior-year, budget, unit-economics, price/volume/cost bridge, contribution-margin, Opex-variance, and AR-aging analysis. The final pages contain only the findings that survived that diagnostic process.
What we would request next in a live engagement: supplier purchase-price history and contract terms; customer pricing/discount approvals; labor vacancy, overtime, and utilization data; and invoice dispute/collection-status detail. Those inputs would turn the strongest hypotheses into operational decisions.
THE TAKEAWAY
Revenue growth is not the same thing as economic progress.
Harborline's top line was healthy enough to hide deterioration underneath it. The value of the reporting system was not that it displayed revenue, margin, Opex, and AR in one place. It was that those views could be connected into a coherent management diagnosis — and a narrower set of actions.