
Dashboard Development
Interactive Power BI and Tableau dashboards built around your existing business data and management priorities.
Dashboard Starter from $295 Explore Power BI dashboard consulting →BUSINESS INTELLIGENCE • REPORTING • ANALYTICS
Jix Analytics & Advisory turns scattered spreadsheets, exports, and operational data into clear dashboards, management reporting, and decision-ready insight.
Less reporting friction.
Bring disconnected files into one reporting view.
Clearer management visibility.
Track the KPIs that actually drive performance.
More useful analysis.
Move beyond charts to the decisions behind the numbers.
WHAT WE DO
We build practical reporting systems for teams that have data, but not yet the visibility they need.
Interactive Power BI and Tableau dashboards built around your existing business data and management priorities.
Dashboard Starter from $295 Explore Power BI dashboard consulting →Data cleanup, modeling, KPI design, a polished management dashboard, and written business insights in one focused engagement.
Flagship engagement from $595 Explore KPI & management reporting →Ongoing KPI updates, dashboard maintenance, and management-ready reporting without rebuilding the same report every month.
Ongoing support from $300/month Explore Excel reporting automation →Focused analysis of sales, customer, product, financial, and operational performance to explain what changed and what deserves management attention.
Scoped project-based engagementsExplore business analytics consulting →FEATURED WORK
FINANCE & EXECUTIVE REPORTING · POWER BI
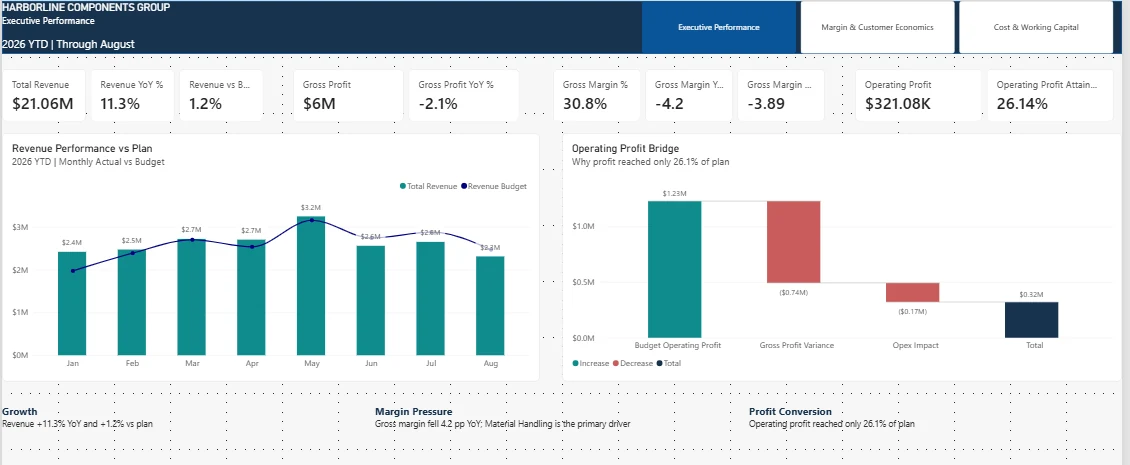
Harborline looked healthy at the top line: revenue was up 11.3% year over year and slightly above plan. Underneath, gross margin had compressed, operating profit reached only 26.1% of budget, and past-due receivables were growing far faster than total AR.
We built the analysis around a harder question than “what changed?”: where was economic value leaking between revenue and cash? The result connects product economics, customer discounting, operating-cost pressure, and working capital into one management story.
MORE WORK
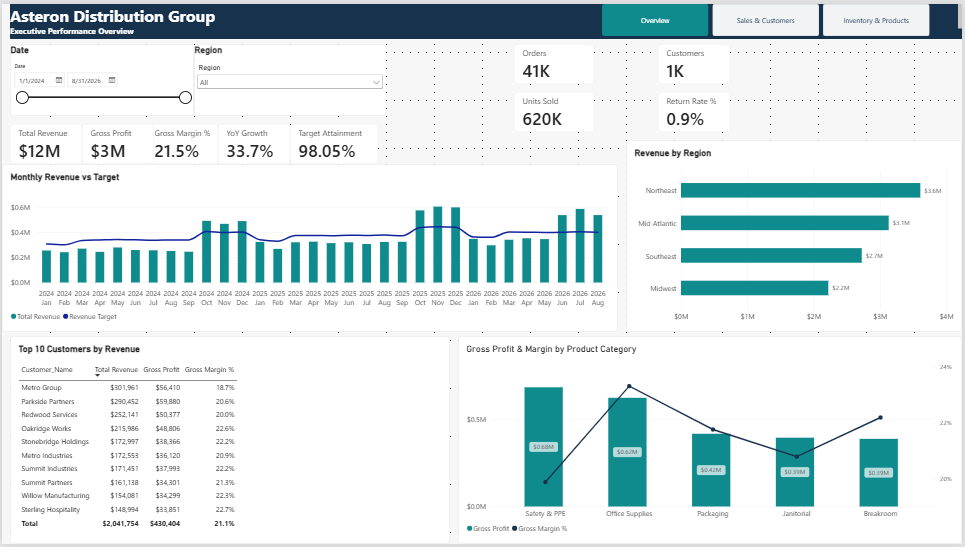
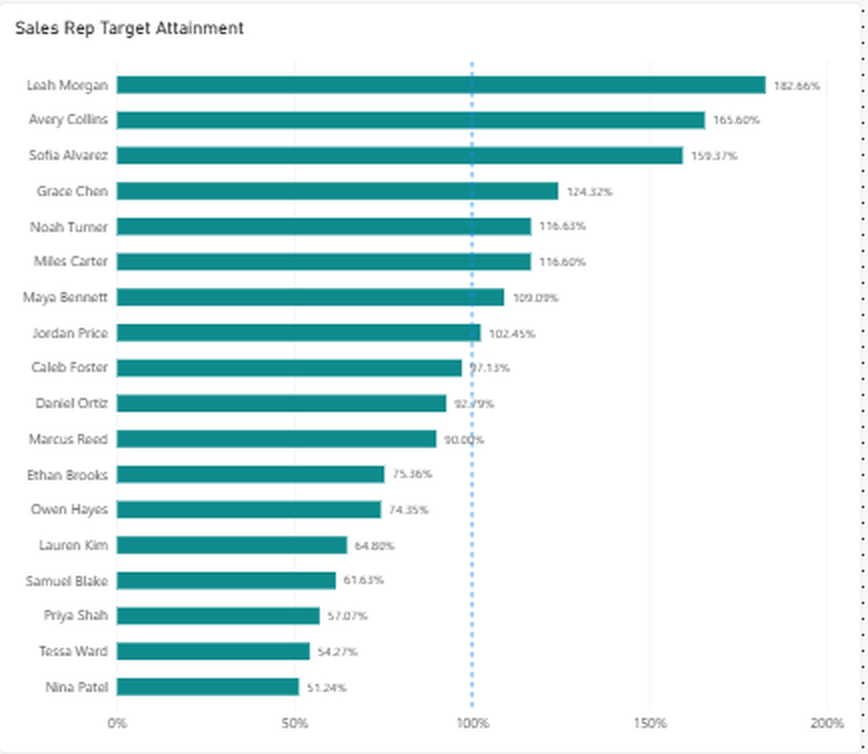
Operations and commercial reporting across sales, customers, products, targets, and inventory — including a deeper analysis of why revenue rankings can misstate sales-rep performance.
JIX INSIGHTS
Useful frameworks and analysis notes drawn from the same business questions behind our dashboard and reporting work.
Define the decisions, KPI logic, comparisons, thresholds, drill-downs, and ownership before designing the visuals.
Read guide →SALES ANALYTICSCombine target attainment, margin, customer mix, and rep-level context into a stronger management view.
Read guide →REPORTINGSeparate the raw data, KPI logic, refresh process, and presentation so the workflow is easier to maintain.
Read guide →HOW WE WORK
Tell us what you track today, what is difficult, and what management needs to see.
We confirm the deliverables, timeline, and fee. Approved projects move to secure deposit or invoice payment.
We clean and structure the data, build the reporting view, validate the numbers, and refine the experience.
You receive the finished work, clear findings, and the option for ongoing management reporting.
ABOUT JIX
Jix Analytics & Advisory helps growing businesses turn everyday operational data into reporting that is easier to understand, maintain, and act on.
Our work centers on business intelligence dashboards, KPI reporting, data cleanup, performance analysis, and recurring management reporting.
We keep the engagement practical: understand the decision, structure the data, build the right view, and surface what matters.
START A PROJECT
Tell us what you are trying to understand or improve. We’ll reply with the most practical next step.
PROJECT INTAKE
Use our short project intake form to share your goals, timeline, budget range, current tools, and a representative sample if helpful. Jix will review your request and respond within one business day.
The secure intake form opens in a new tab. Prefer email? Use hello@jixanalytics.com.